
The Market Leaves
Footprints in Time
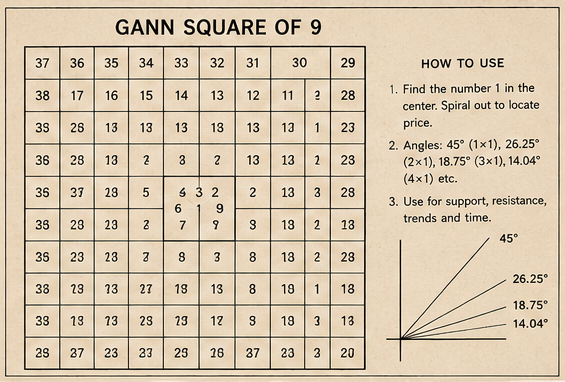
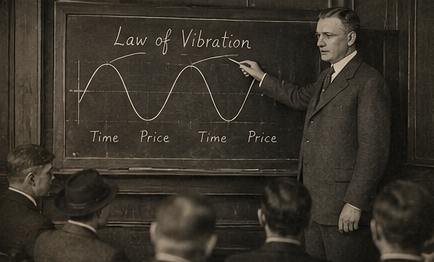
Before the move happens, the cycle is already written. Gann saw it a century ago. Today, the scanner finds where in the record it was written before — and shows you what came next.
Time Cycle Analysis
Every market traces repeating time cycles. We identify where the current cycle sits within the larger rhythm — and what phase comes next.
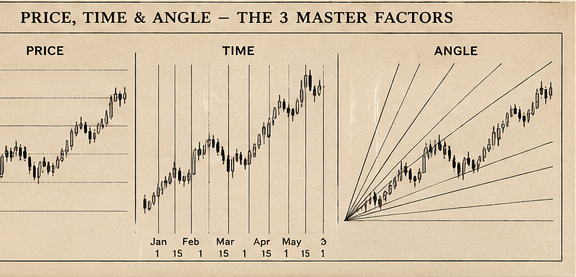
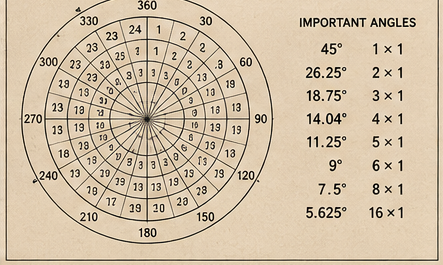
Price-Time Squaring
When price and time reach a natural square, a change in trend is due. We detect these geometric balances as they form in real time across Index, Crypto, Commodity, and Forex markets.
Cycle Path Projection
Once a cycle match is located, the forward arc that completed the cycle in history becomes our projected path — displayed visually on the chart.
The scanner does not predict. It listens to the rhythm that is already there — searching the full historical record for where the same rhythm completed before, then projecting the forward arc with computational precision.
Read the Rhythm
Full OHLCV history is ingested across symbols and timeframes. The scanner sees what most traders miss — the repeating temporal structure beneath the noise.
Locate the Echo
The scanner searches the entire historical record for a structural match — a window where the market traced the same cyclical rhythm. Gann did this by eye. The scanner does it in seconds.
Project the Arc
The forward arc from the matched cycle is scaled and projected from the current close — with calculated volatility and amplitude adjustment. The chart reveals the path.
What Are the Cycles Showing?
Live cycle forecasts across six timeframes. Index, Crypto, Commodity, and Forex markets. The charts are waiting.
Open the Scanner